Observability Stack for Self-Hosted Agent Workloads
Agents fail silently on 200 responses; step-level traces expose what dashboards miss.
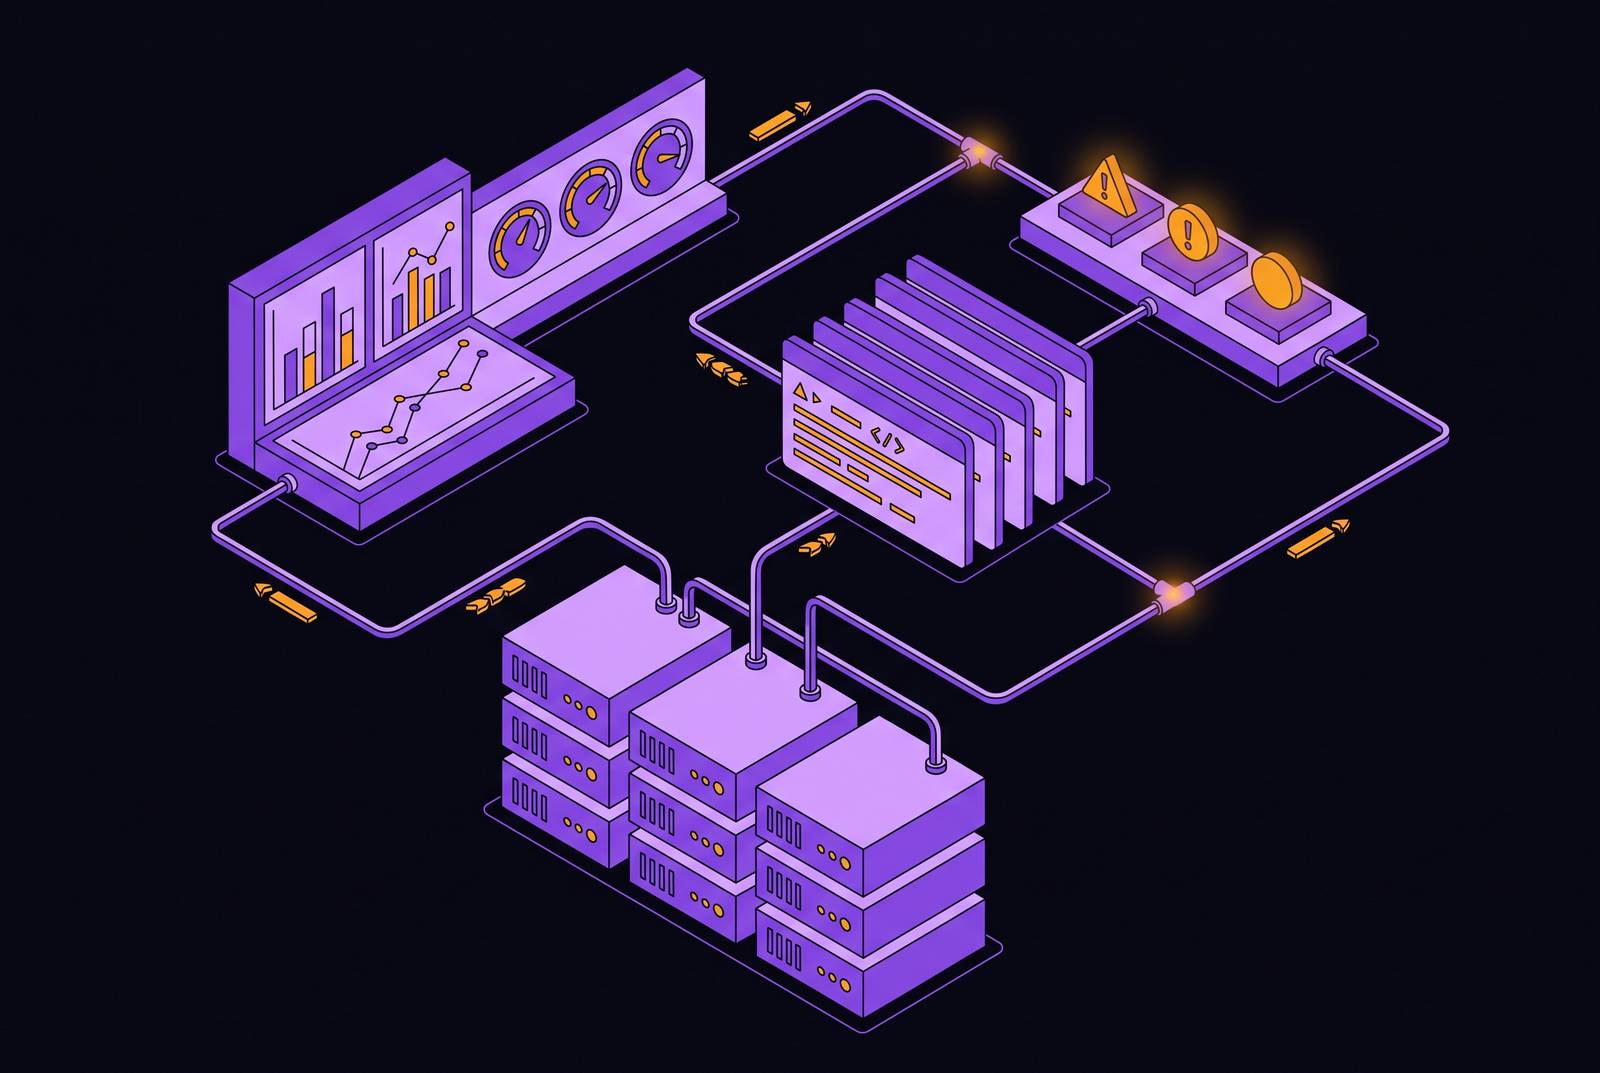
A standard observability dashboard can show every green light on an agent service, but the agent itself has looped twice, called the wrong tool, and returned a confidently wrong answer wrapped in a 200 response. Self-hosted agents fail in ways that resemble success: a healthy HTTP status can sit on top of an unnecessary tool call, a hallucinated argument, or a plan that quietly drifted away from what the user actually asked for.
Traditional APM assumes a deterministic service. The same input produces the same output, and an HTTP error functions as a reliable signal that something went wrong. None of those assumptions survive contact with an agent. An agent's execution path branches on model output, and the same prompt can trigger a completely different sequence of tool calls on two consecutive runs. A single "happy path" trace, captured once and treated as representative, tells you almost nothing about how the agent behaves the other eleven times it runs that day.
The failure modes that matter most are the ones that never trip an error rate alert. A looping agent that burns through retries while still returning 200s looks identical, from the dashboard's vantage point, to a well-behaved one. None of these register as errors because none of them are errors in the sense that traditional monitoring understands the term.
Most production agent bugs live in the space between "the service is up" and "the agent behaved correctly," and closing that space requires step-level traces. An error rate, a latency percentile, a request count: these describe the health of a pipe, not the quality of what moved through it. You have to observe an agent's reasoning and its actions at each step, not just confirm that the process stayed alive long enough to respond.
Why self-hosted deployments compound the visibility problem
Self-hosting removes the observability scaffolding that managed cloud platforms bundle by default, so teams have to make architectural decisions explicitly that cloud providers would otherwise make implicitly. A self-hosted fleet starts with none of that; every piece has to be assembled by hand.
Data residency is frequently the reason a team chose to self-host in the first place, and that same requirement rules out routing telemetry to a SaaS backend. If the agent's data cannot leave your owned infrastructure, the observability stack watching that agent cannot leave it either. The stack has to run on the same infrastructure the agents run on. That means the convenience of a hosted logging platform is off the table from the start.
Firecracker micro-VM fleets add a structural wrinkle: metrics come through Firecracker's own API endpoint rather than through a Docker daemon or containerd, so the container-centric assumptions baked into most APM tools don't apply.
The asymmetry that results is severe. A self-hosted failure with no instrumentation in place produces no signal whatsoever, not a degraded dashboard or a yellow warning, just silence. Deferring observability on self-hosted infrastructure costs more than deferring it on a managed platform, because there is no fallback layer quietly collecting basic telemetry in the background. You have to build the observability stack for a self-hosted agent fleet component by component, and you need a deliberate decision at each layer. Nothing arrives by default.
The four span types that form a minimum viable agent trace
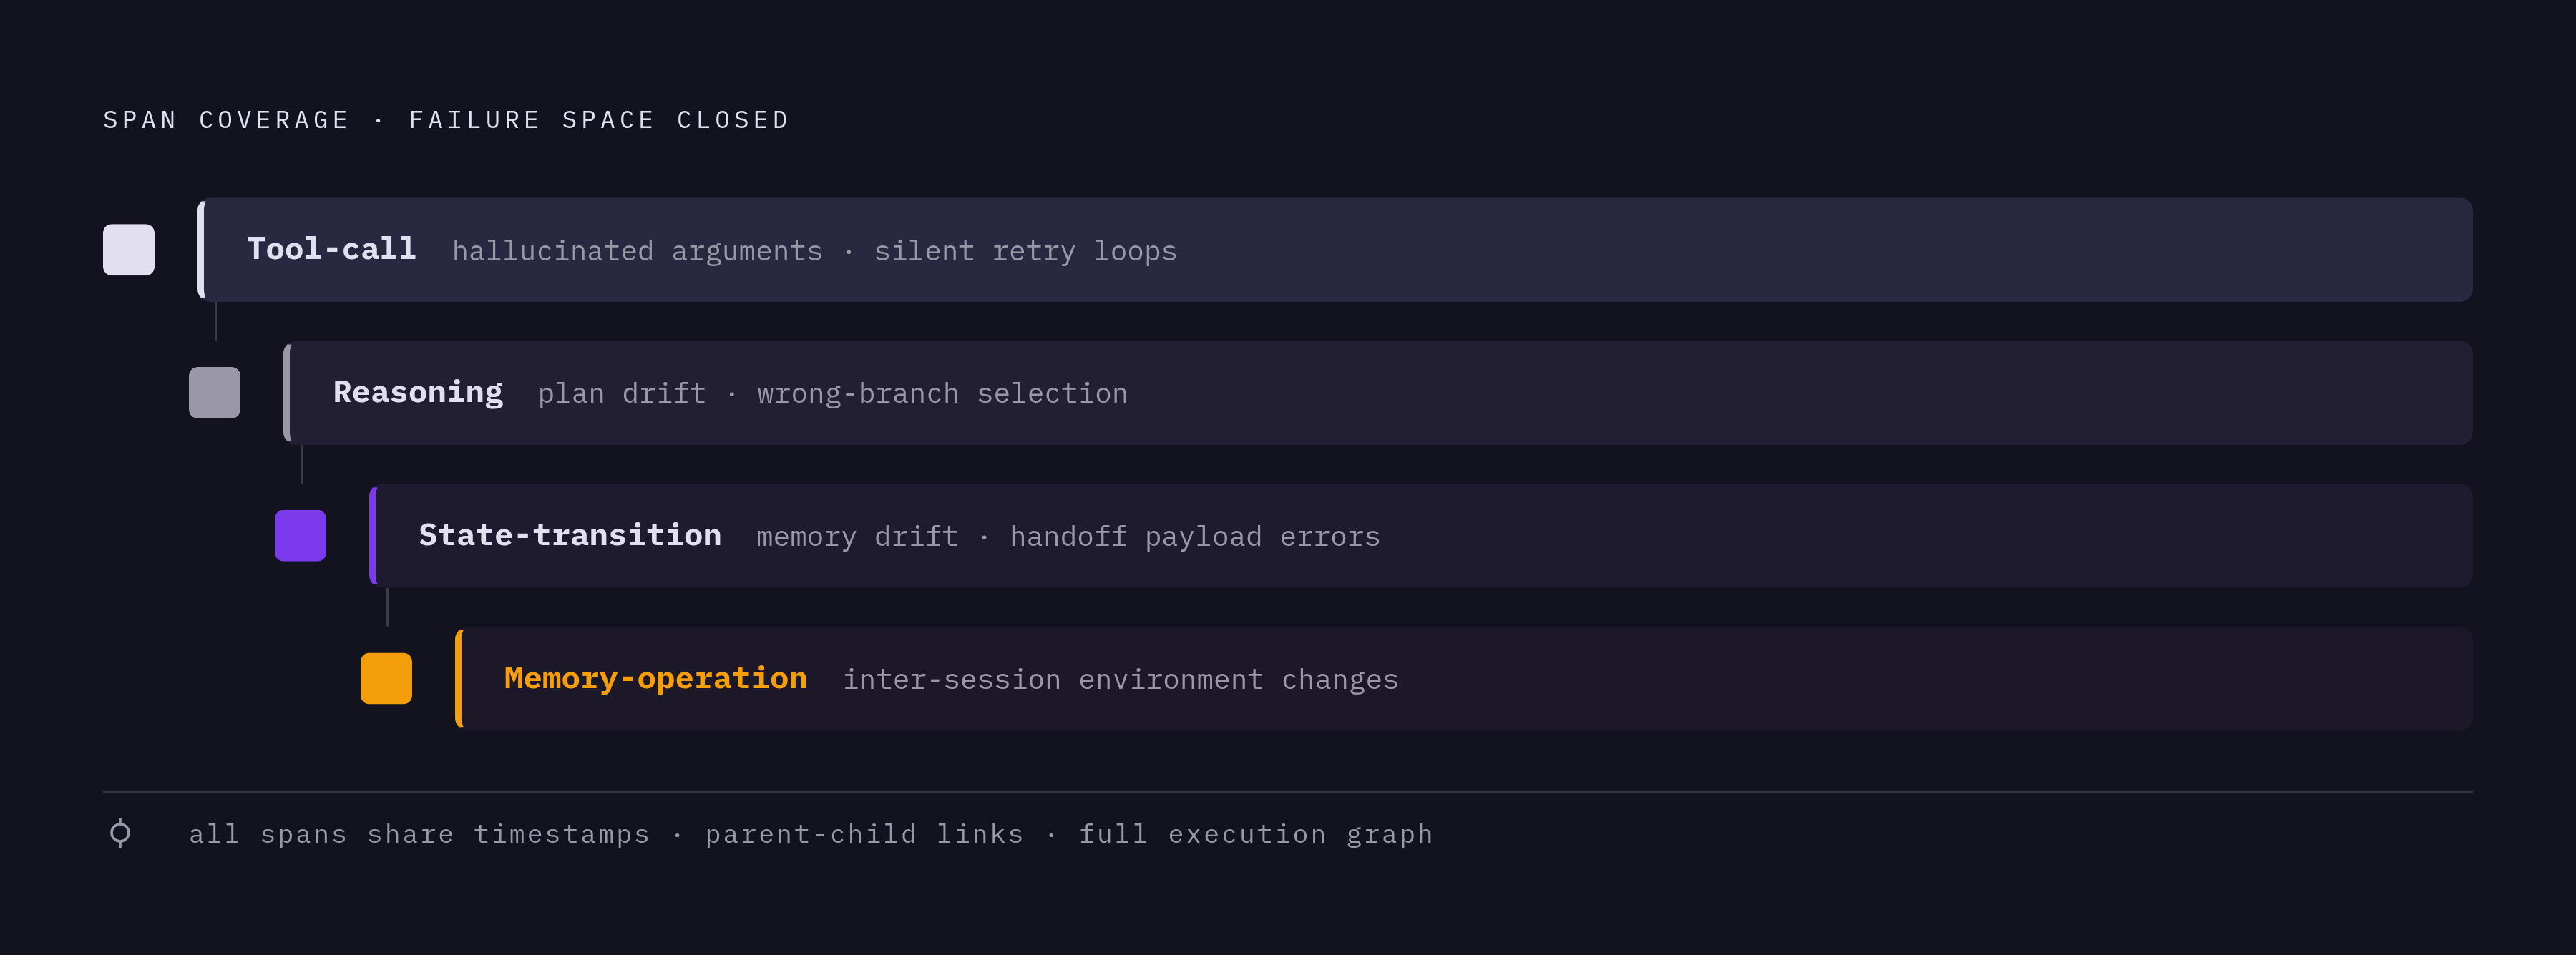
A complete agent trace rests on four typed span categories, and each one exists because it catches a failure the other three cannot.
Tool-call spans record the tool name, the arguments passed to it, the raw output returned, the duration, the retry count, and the error state. Without this level of detail, a hallucinated argument or a silent retry loop looks indistinguishable from ordinary traffic, because the tool call still technically succeeds.
Reasoning spans capture the model's plan, the action it chose, the observation it made from that action, and what it decided to do next. These spans expose plan drift and wrong-branch selection, failures that a single flat LLM span cannot show because it only records the input and output of one call, not the sequence of decisions that led there.
State-transition spans record working memory before and after each step, including context edits and handoff payloads between agents or subprocesses. In persistent agent deployments, where an agent may wake from a snapshot or resume a session after sleeping, this span type carries particular weight. Capturing context edits and handoff payloads is what catches memory drift, a risk stateless architectures carry no continuity to incur.
Every span carries timestamps and parent-child links, so a single trace can reconstruct the full execution graph of one agent run as a hierarchy, not a flat list. In multi-agent deployments, those parent-child relationships have to be preserved across agent handoffs. If a handoff breaks the chain, the trace breaks at that exact boundary, and the handoff itself becomes the one part of the system nobody can see into.
OpenTelemetry GenAI conventions as the instrumentation foundation
Building the four span types on top of the OpenTelemetry GenAI semantic conventions decouples the trace schema from any single observability vendor.
The OpenTelemetry GenAI spec defines a shared vocabulary of gen_ai.* span and metric attributes that any instrumentation library can emit and any backend can ingest. The spec spans six layers: client (model-call) spans, agent and workflow spans, MCP conventions, semantic events, metrics, and provider-specific attributes. Cost and latency reasoning depends on these two signals; without them, there is no reliable way to answer basic questions about what an agent run cost or how long it took relative to its peers.
Self-hosted teams need to plan around a specific stability caveat. Attribute names under Development status can change without a major version bump, so if you build a self-hosted pipeline on an assumption about a specific attribute name, it can break on a minor upgrade. Teams should version-pin their instrumentation and build schema validation directly into their telemetry pipeline, rather than discovering a renamed attribute when a dashboard goes blank.
Instrumenting across frameworks without rewriting agents
Most self-hosted agent fleets run several frameworks at once rather than standardizing on one, and an instrumentation strategy tied to a single framework's SDK will fracture the moment the stack changes. A strategy built around any one of these will leave the others uninstrumented.
Two paths together cover the full surface. OpenTelemetry SDK instrumentation serves as the fallback for unsupported or in-house frameworks, covering any code path a native adapter cannot reach.
Its instrumentation hooks attach at graph boundaries, and those boundaries align naturally with the reasoning-span and state-transition-span schema described earlier, so LangGraph is one of the more straightforward frameworks to wire into a four-span trace model.
The test for any instrumentation decision is simple: does switching this framework require rebuilding the observability pipeline? If the answer is yes, the strategy is a liability rather than an asset, because frameworks in this space change faster than most organizations want to admit.
For self-hosted Firecracker fleets specifically, like those deployed on Maritime, the VM boundary adds its own layer: metrics generated inside the microVM have to be exported out through a sidecar process or a vsock channel, since there's no shared daemon listening across the boundary the way there would be in a container environment. You should design that export path into the VM template from the start, not retrofit it after the fleet is already running production traffic.
Persistent state visibility: what the trace alone cannot tell you
Agents with persistent state, meaning files, credentials, memory, and installed dependencies that survive sleep and redeploy, need more than a per-run trace to be observable. A trace captures what happened during one execution; it says nothing about the environment the agent will wake up into the next time it runs. The observability stack has to expose that environment directly, not infer it from execution logs.
A stateless agent's entire history lives inside its traces. A persistent agent's history splits across two places: its traces, and its live environment, including disk contents, installed packages, cached credentials, and vector store entries written during previous sessions. This split is what creates an entirely separate category of failure. A per-user agent model can leak memory between tenants, and you won't find it in any single session's trace.
The apartment-model architecture of a persistent agent, one with its own space, its own memory, and its own continuity across sessions, makes inter-session visibility a structural requirement. Aggregate fleet metrics average all of this away, so you lose sight of exactly the per-tenant anomalies that matter.
The practical fix is a structured log entry emitted at every snapshot and restore event, recording an environment fingerprint (a disk hash or package manifest hash), the session ID, the tenant ID, and the delta from the previous snapshot. That log entry becomes the inter-session observability record, the one artifact that tells a team what changed in an agent's environment between the moment it went to sleep and the moment it woke back up.
Choosing a self-hosted observability backend
The deployment model of the observability backend should be the first filter applied, before any feature comparison, because it determines data residency, operational burden, and scale ceiling all at once. Teams that start by comparing dashboards and alerting features before settling this question tend to end up locked into a backend that violates the very constraint that drove them to self-host.
Three deployment models cover the field. Hybrid or enterprise on-premises deployments keep the data plane on owned infrastructure but let the control plane be managed, so teams get a middle path when they want operational simplicity without exposing trace data to a third party.
Once you have settled on a deployment model, several secondary criteria determine fit within it. Free tiers on managed tools commonly retain traces for only seven to fourteen days, which is inadequate for debugging a long-running persistent agent whose failure may only become visible across several sessions. Storage architecture matters at scale: ClickHouse-backed self-hosted options scale on owned infrastructure, while single-node open-source tools hit a ceiling without a managed layer behind them.
A handful of platforms fit the self-hosted or open-source requirement directly. MLflow is Apache 2.0 licensed under Linux Foundation governance, OpenTelemetry-native, with over 60 framework integrations and unlimited data retention when self-hosted; self-hosting is a single-service deployment, and the platform covers tracing, evaluation, prompt optimization, and an AI gateway without an enterprise paywall on any feature. HoneyHive supports multi-tenant SaaS, single-tenant SaaS, hybrid, or fully self-hosted deployment, with a Developer tier at 10,000 events per month and custom Enterprise pricing, and is a reasonable fit for security-sensitive deployments specifically. Portkey offers an open-source self-hosted gateway option, with a Developer tier at 10,000 logs per month and a Production tier at $49 a month; it matters most when an AI gateway is part of the requirement, and a hosted gateway becomes part of the live runtime request path unless it, too, is self-hosted.
Wiring the observability stack into the agent infrastructure layer
The observability stack is only as complete as the infrastructure layer underneath it allows. If an agent runtime doesn't expose per-VM metrics, per-tenant state, and snapshot events at the infrastructure boundary, it will produce traces that look thorough but miss exactly the signals that matter most for persistent, isolated agents.
A handful of infrastructure requirements make the rest of the stack coherent. Firecracker exposes these through its own API endpoint, but each VM still needs its own custom exporter to get that data into the pipeline. Snapshot and restore events need to be emitted as structured telemetry, since this is the inter-session observability record described earlier; if the runtime never emits them, the gap between sessions stays instrumentation-dark no matter how good the in-session tracing is. Wake latency matters too: an agent that takes several seconds to restore from a snapshot introduces dead time in the trace with no span attached to it, so the runtime needs to restore fast enough that the resume event is something the observability pipeline can actually capture rather than something that gets lost in an unmeasured gap. Per-tenant VM isolation also simplifies the picture in one respect: shared-kernel accounting ambiguity of the kind that occurs in shared container environments cannot arise here, since each tenant's telemetry is already cleanly separated by the isolation boundary itself.
Maritime's architecture illustrates what this looks like when the infrastructure layer is built with these requirements in mind. Each agent runs in its own isolated Firecracker micro-VM on bare metal, and it gets a persistent disk plus snapshot-restore scheduling that wakes it in under a second. That combination, per-VM metrics, per-tenant state, and snapshot events that can be emitted as telemetry, is what an observability stack needs from the infrastructure layer to close the visibility gap described throughout this piece.
Assembling the full stack comes down to a short, concrete sequence. Instrument the four span types, tool calls, reasoning, state transitions, and memory operations, using OTel GenAI conventions with version-pinned attributes. Add MCP tracing spans to cover the tool layer. Emit snapshot and restore events as structured telemetry at the infrastructure layer. Route all of this telemetry through an OTLP pipeline into a self-hosted backend that satisfies data residency requirements and supports per-tenant retention. Confirm that the backend can correlate traces across sessions using a stable tenant and agent identifier, one that persists across snapshots and does not reset with each new VM instance.
Observability for self-hosted agents is a design decision made simultaneously at the infrastructure, instrumentation, and schema layers, not a dashboard added after the fact. Teams that put it off until something breaks in production tend to discover that what was missing wasn't a missing SDK call, but an architectural gap that no amount of after-the-fact logging can retrofit.